Activity reports
Visualise DBMail activity with Grafana and SQL.
Login activity is recorded in dbmail_authlog and can be easily visualised with Grafana
Create a Grafana user, then grant them access to the dbmail_authlog table.
CREATE ROLE grafana WITH NOLOGIN;
CREATE ROLE grafanareader WITH LOGIN IN GROUP grafana PASSWORD 'password';

GRANT CONNECT ON DATABASE dbmail TO grafana;
GRANT SELECT (login_time, status) ON dbmail_authlog TO grafana;
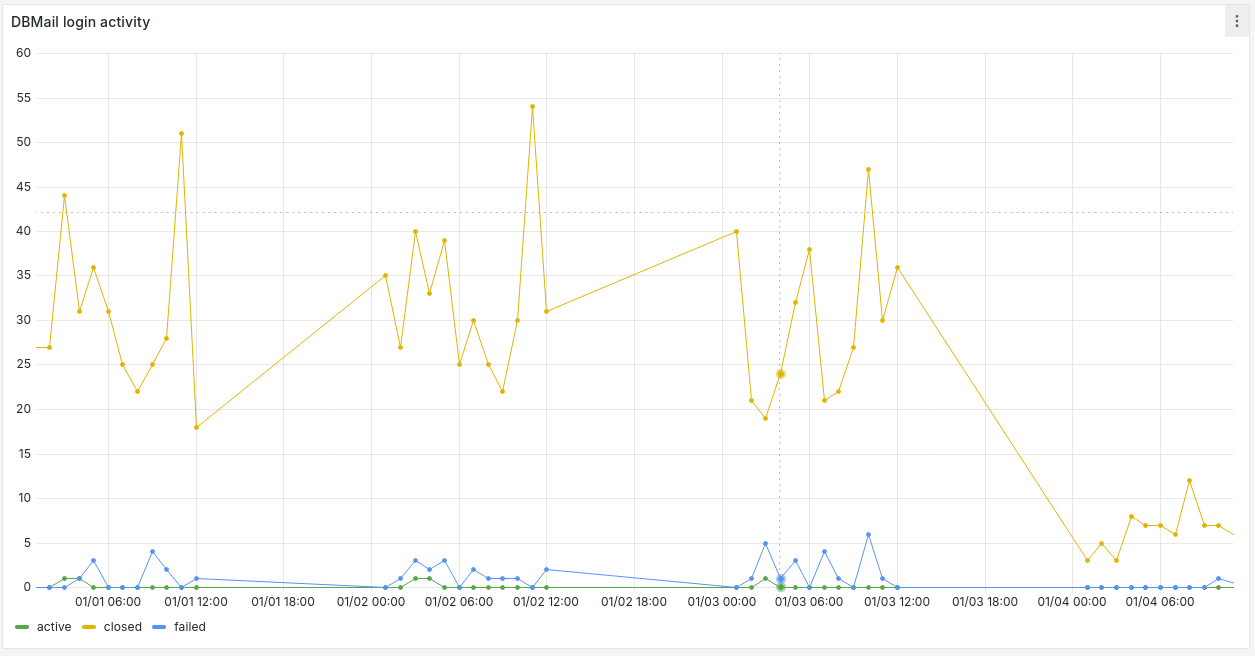
There are three type of record in dbmail_authlog, "active" where a user is actively using DBMail, "closed" where a session has finished, and "failed" where a login attempt failed. The following Graphana graph visualises these activities:

The above graph used the following query:
SELECT to_char(login_time, 'yyyy-mm-dd hh:mi:00')::timestamp AS login_time,
  SUM(CASE status
    WHEN 'active' THEN 1
    ELSE 0
  END) AS active,
  SUM(CASE status
    WHEN 'closed' THEN 1
    ELSE 0
  END) AS closed,
  SUM(CASE status
    WHEN 'failed' THEN 1
    ELSE 0
  END) AS failed
FROM dbmail_authlog
WHERE $__timeFilter(login_time)
GROUP BY 1
ORDER BY 1
For MySQL use the following for login_time:
str_to_date(date_format(now(), '%Y-%m-%d %H:%i:00'), '%Y-%m-%d %H:%i:00') AS login_time